

Views only tell part of the story
You write, structure and publish your content in Prepr. Once it's live, another question becomes important: did it actually work?
For a long time, views were the easiest answer. They tell you which content attracted an audience, but not whether that content contributed to a conversion or helped move someone closer to becoming a customer.
The data to answer that question may already exist. Analytics tools like Google Analytics and Mixpanel can show what happens after someone visits a page, but that data lives in a separate tool and is tied to the page rather than the content item in your CMS. That leaves a gap between measuring content performance and making decisions about the content itself.
Content item metrics bring those two things together. You can now see how your content performs directly in Prepr, including not just what gets read, but which content contributes to your goals.
Nine metrics, directly on the content item
Prepr now shows nine content item metrics, grouped into reach, engagement, and performance.
You can see performance at a glance from the content item list. A trend line next to each item shows whether views are rising or falling, and hovering over it gives you a quick overview of the numbers.

Open a content item and you'll find the same trend line. From there, you can open the full metrics view to explore all nine metrics and choose a date range within the last 90 days.
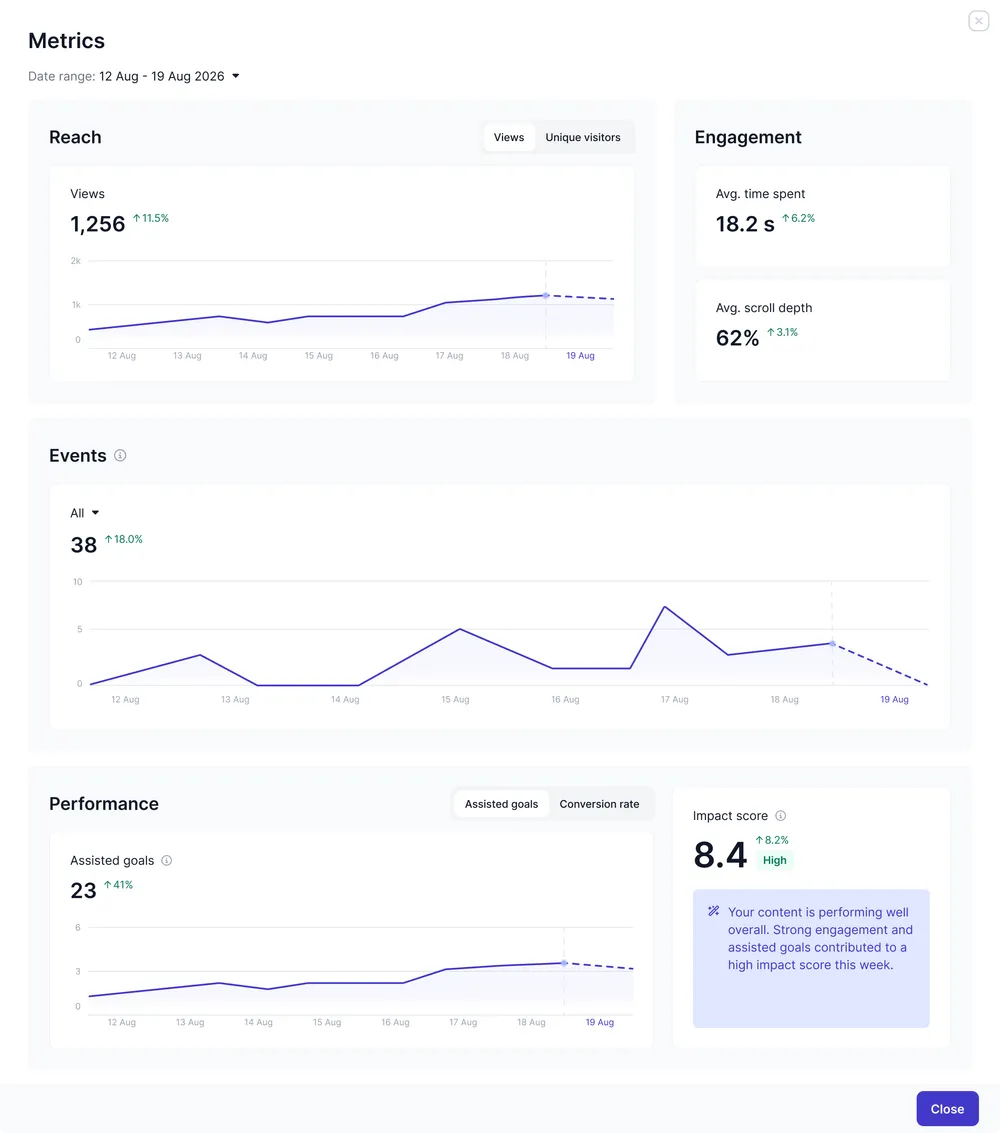
The metrics start with two familiar questions: how many people saw the content, and what did they do with it?
Reach shows views and unique visitors. Together, they tell you how often an item was viewed and how many individual visitors those views came from.
Engagement tells you more about what happened after someone arrived. Average time spent and average scroll depth help you understand whether people actually engaged with the content.
You can also see events sent by your front end. That could be a click on a call to action, a video being played, or a form being opened.
These numbers help explain how people interact with an item. But they still don't answer the bigger question: did this content contribute to a result?
From views to assisted goals
That's where assisted goals come in.
A goal is a result you've defined for your website, such as a quote request, demo booking, or signup. Assisted goals show how many times a content item was viewed in a session that also resulted in one of those goals.
Imagine an article receives 1,000 views. On its own, that tells you it attracted attention. If 100 of those views happened in sessions where a visitor went on to complete a goal, you now know something more useful: the article was part of 100 converting journeys.
Conversion rate puts those two numbers into context. It's calculated by dividing assisted goals by views.
That means an item can receive lots of traffic but have a relatively low conversion rate, while another item with far fewer views can have a high conversion rate because it frequently appears in sessions that result in a goal.
This distinction matters. The first piece might have a conversion problem after the click: plenty of people arrive, but relatively few go on to convert. The second may already be effective with the people who find it and simply needs more visibility.
But assisted goals and conversion rate only tell you that a content item was part of a converting session. They don't tell you how much of that conversion it should be credited for.
For that, there's impact score.
See how much each content item contributed
A conversion is rarely the result of a single page.
Someone might first discover an article through search, read a case study a few minutes later, visit your pricing page, and finally submit a quote request. Giving all the credit to the final page would ignore the content that helped them get there.
Impact score is designed to show that contribution.
Every completed goal is worth one point. Prepr divides that point across all the content views in the session. The closer a view happens to the completed goal, the larger the share it receives. All the shares in a session always add up to exactly one.
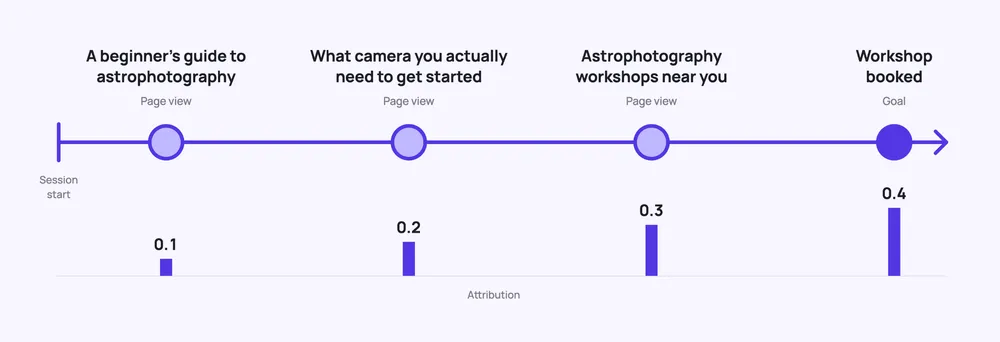
Take a visitor who finds your article, A beginner's guide to astrophotography, through search. They read most of it and continue to your gear guide, What camera and lens you actually need to get started. From there, they open Astrophotography workshops near you before booking a spot.
That's four views leading to one completed goal.
The article might receive 0.1 of the credit, the case study 0.2, the pricing page 0.3, and the quote request page 0.4. Together, they add up to one.
Prepr repeats that calculation for every converting session in the selected period and adds up the shares each content item receives.
That means an impact score doesn't have to be a whole number. An item with a score of 8.4 has received the equivalent of 8.4 goals in total from its contribution across all those sessions.
Prepr also adds context to the score with a label. A High impact score means the item is among the top 20% of content items contributing to goals, compared with other items that had activity during the same period.
So instead of only asking which page did someone convert on?, you can start asking a more useful question: which content helped them get there?
Turn the numbers into content decisions
No single metric tells you whether a piece of content is good or bad. The useful part comes from looking at the metrics together.
Impact score, for example, is influenced by how much traffic an item receives, how often it appears in sessions that convert, and where it appears in those journeys. Looking at those signals together can reveal very different opportunities.
- Plenty of views, low impact score. The content attracts traffic but rarely appears in sessions that result in a goal. Look at who is reaching the content and whether there's a clear, relevant next step.
- Few views, high conversion rate. The content frequently contributes when people find it, but not enough people are seeing it. That points more toward a distribution or discoverability opportunity than a writing problem.
- High impact score, low conversion rate. A large amount of traffic passes through the item, so it accumulates credit across many journeys even though only a relatively small proportion of its views contribute to goals. This can be perfectly normal for high-traffic hub and overview pages.
Context matters here.
Pages that naturally sit close to a conversion, such as pricing or contact pages, are likely to perform differently from articles that introduce someone to a topic much earlier in their journey. A homepage also receives traffic from a much broader audience than a detailed article.
So rather than ranking every content item against every other item, compare like with like. Compare articles with articles, landing pages with landing pages, and similar stages of the journey with each other.
The goal isn't to find the page with the biggest number. It's to understand the role different content plays and identify where you can improve it.
Get started with content item metrics
To start collecting content item metrics, Prepr needs to be able to connect activity on your website to the corresponding content item. Views are recorded once the Prepr Tracking Code and the item ID have been implemented on the page.
Once tracking is in place, you can enable metrics for the content models you want them to appear on.
Content item metrics are available on all plans and will roll out gradually over the next few weeks.
See what your content contributes
Publishing content shouldn't be the end of the process. By seeing what happens next, you can learn which content works, which doesn't, and where there are opportunities to improve. Those insights don't just help you optimize existing content, but also make more informed decisions about what content to create next.
Content item metrics bring those signals directly into Prepr, from reach and engagement to assisted goals, conversion rate, and impact score.
So the next time you're in Prepr, open the metrics for something you recently published. Don't just look at how many people viewed it. Look at what happened next.